← A Level Economics Revision · Home

The AD/AS equilibrium diagram — A-Level Economics
Play the game and get tested on every point of the diagram — every wrong answer gets a diagnosis. Then study the answers below. Measure what you don’t know, then fix what you don’t know.
The diagram
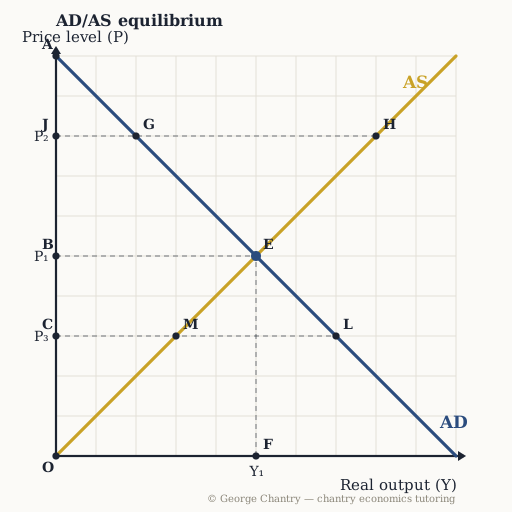
AD slopes down, AS slopes up, and the economy settles where they cross — point E, at price level P₁ and real output Y₁. Above that price level (P₂) firms want to produce 8 at H while buyers only take 2 at G: excess supply, and the price level is bid down. Below it (P₃) buyers want 7 at L while firms only produce 3 at M: excess demand, and the price level is bid up. E is the only resting point.
The game’s questions — with the answers explained on the diagram
These are the exact questions the game asks. Play first if you want the real test — or study them here with the answer for each one.
1. Which point is the macroeconomic equilibrium?
E — where AS crosses AD, at price level P₁ and real output Y₁. Every other point on either curve is a plan, not an outcome: the crossing is the one place buyers’ and firms’ plans match, so nothing pushes the price level either way.
2. AD is total demand in the economy. Which expression gives its components?
C + I + G + X − M — consumption, investment, government spending and net exports. Imports are a leakage, so they subtract; savings is a withdrawal from the circular flow, not a component. Low demand can come from any of the four falling: in COVID, lockdown lowered C and probably I, while G rose to compensate through furlough.
3. What does the horizontal axis measure?
Real output — real GDP, the volume of goods and services actually produced. Price level goes on the vertical axis, real output on the horizontal. A rise from Y₁ to Y₂ is economic growth, by definition — which is why the whole macro course is read off this one pair of axes.
4. The price level is stuck at P₂ = 8. Which point shows the real output firms are willing to supply?
H — read across from 8 to the AS curve, then down: firms want to produce 8. Output supplied lives on AS; output demanded lives on AD, at point G — 2. Two curves, two readings, never mixed.
5. At the price level P₂ = 8, above equilibrium, what does this economy have?
Excess supply of 6. Firms want to produce 8 (H) but buyers only take 2 (G) — the horizontal gap G to H. Unsold output means firms cut prices and cut production, and the economy slides back down to E.
6. Now the price level is at P₃ = 3, below equilibrium. What is happening?
Excess demand of 4. Buyers want 7 (point L), firms only produce 3 (point M). That pressure bids the price level up and pulls output along AS until the two plans match again at E. Above equilibrium it is sellers who are frustrated; below it, buyers.
Now test yourself
Every corner has a letter. Answer with the points and areas, exactly like the exam. Every wrong answer gets a diagnosis — that is the diagram telling you what to fix.