← A Level Economics Revision · Home

The AD shift right (with multiplier) diagram — A-Level Economics
Play the game and get tested on every point of the diagram — every wrong answer gets a diagnosis. Then study the answers below. Measure what you don’t know, then fix what you don’t know.
The diagram
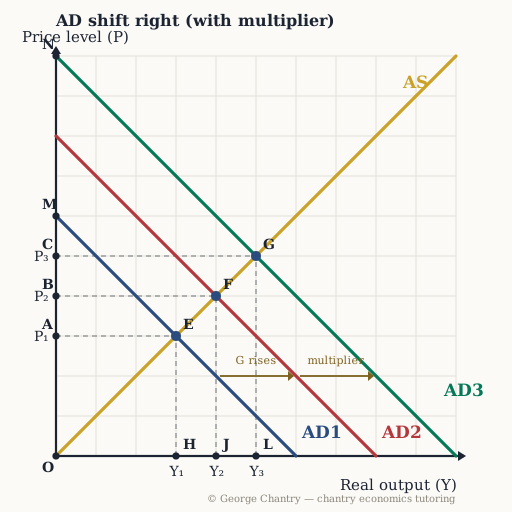
The government raises NHS funding, so G rises and AD shifts from AD1 to AD2: the economy moves up AS from E to F. Then the multiplier — the doctors spend their wages, and that spending is someone else’s income — shifts AD2 to AD3, taking the economy on to G. Each shift arrow runs from one AD curve to the next at the same price level. Real output rises Y₁ → Y₂ → Y₃, and the price level rises with it: P₁ → P₂ → P₃.
The game’s questions — with the answers explained on the diagram
These are the exact questions the game asks. Play first if you want the real test — or study them here with the answer for each one.
1. The government raises NHS funding, so G rises and AD shifts from AD1 to AD2. Why does a second shift, AD2 to AD3, follow?
The multiplier. Whenever one person spends money another person receives it — every expenditure is someone else’s income, and that income is partially spent again. Government funds the NHS → doctors’ wages rise → the doctors spend on consumption → a second increase in AD. The cycle runs until the injection has leaked out of the circular flow, and the size of the effect depends on the leakages: savings, taxation and imports.
2. Which point is the final equilibrium, once the multiplier has worked through?
G — where AS crosses AD3, at P₃ and Y₃. Follow the chain: G rises → AD1 to AD2 → equilibrium F; then the multiplier → AD2 to AD3 → equilibrium G. The final equilibrium is always where AS crosses the last demand curve.
3. Which point is the equilibrium immediately after the rise in G, but before the multiplier rounds?
F — the intermediate equilibrium. Two shifts, three equilibria: the injection alone takes you E → F, and only then does the recycled income carry you F → G. Marking both is what earns the analysis marks.
4. Why does unemployment fall as the economy moves from E to G?
Labour is a derived demand — firms only hire workers because consumers want the goods and services those workers produce. As demand for goods and services rises, firms need more workers to make the extra output, which directly reduces cyclical unemployment. Say the words “derived demand” in the exam.
5. The cost of the stimulus — why does demand-pull inflation appear as output reaches Y₃?
Spare capacity runs out. Firms compete for the same fixed factors of production and bid up wages, raw materials and rents; that cost pressure feeds through to prices, so the price level climbs P₁ → P₂ → P₃. Notice the trade-off — every bit of extra growth here is bought with a bit more inflation.
6. Which distance measures the extra real output the multiplier delivers, over and above the initial injection?
J L — Y₂ out to Y₃, the second shift only. Split the gain in two: H J is what the government’s own spending bought, J L is what the multiplier added on top. The eventual increase in real output is significantly larger than the initial fiscal injection, and that gap is the multiplier effect drawn on the diagram.
Now test yourself
Every corner has a letter. Answer with the points and areas, exactly like the exam. Every wrong answer gets a diagnosis — that is the diagram telling you what to fix.