
A-Level Economics results
Every one of them improved — one line, one colour, one student
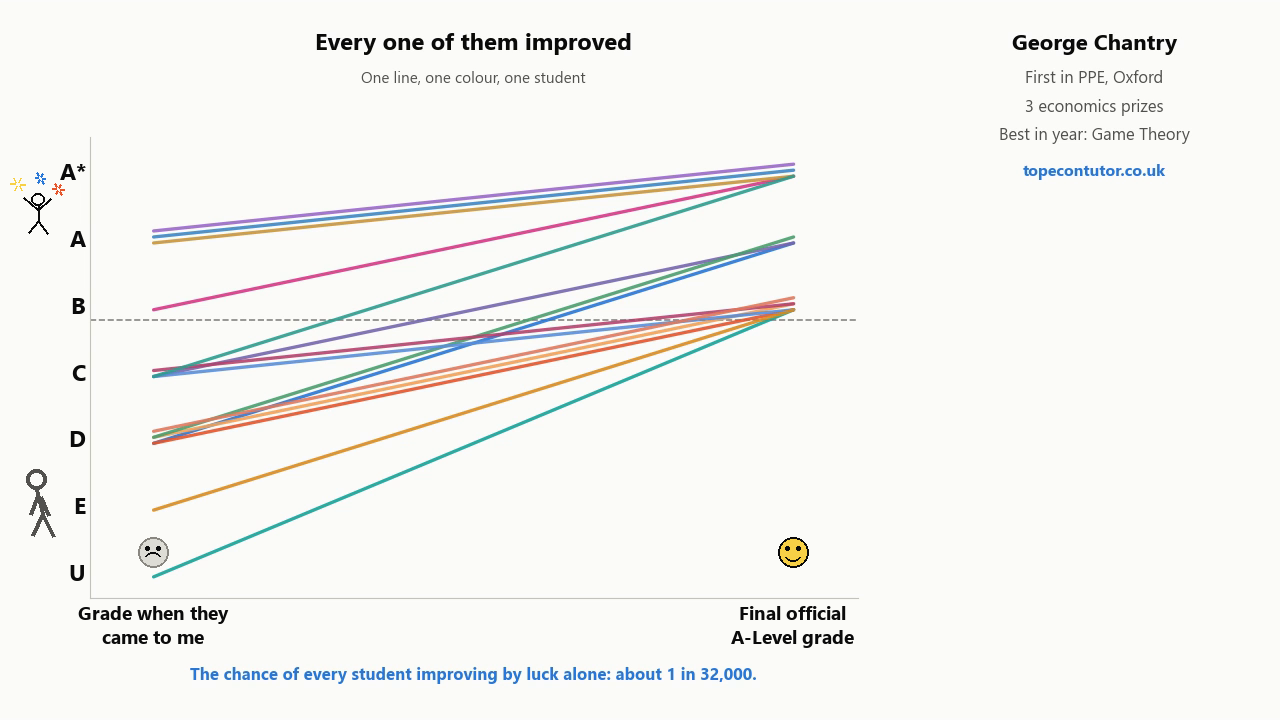
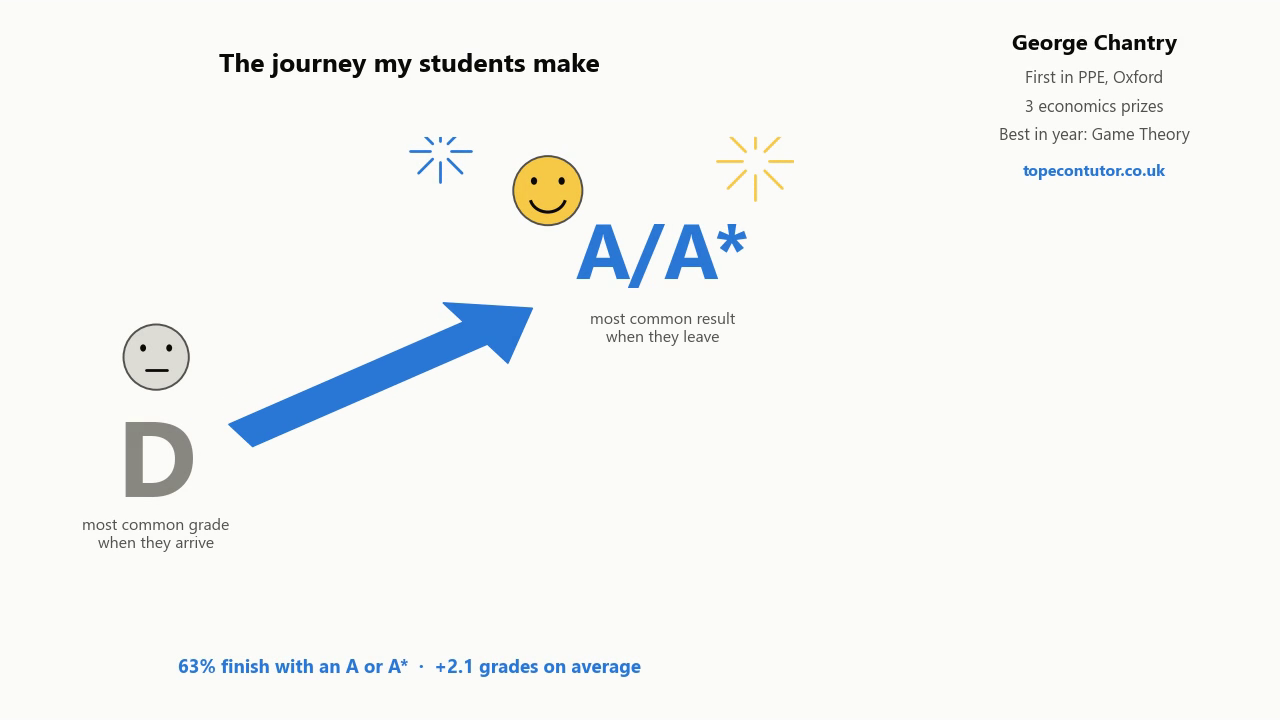
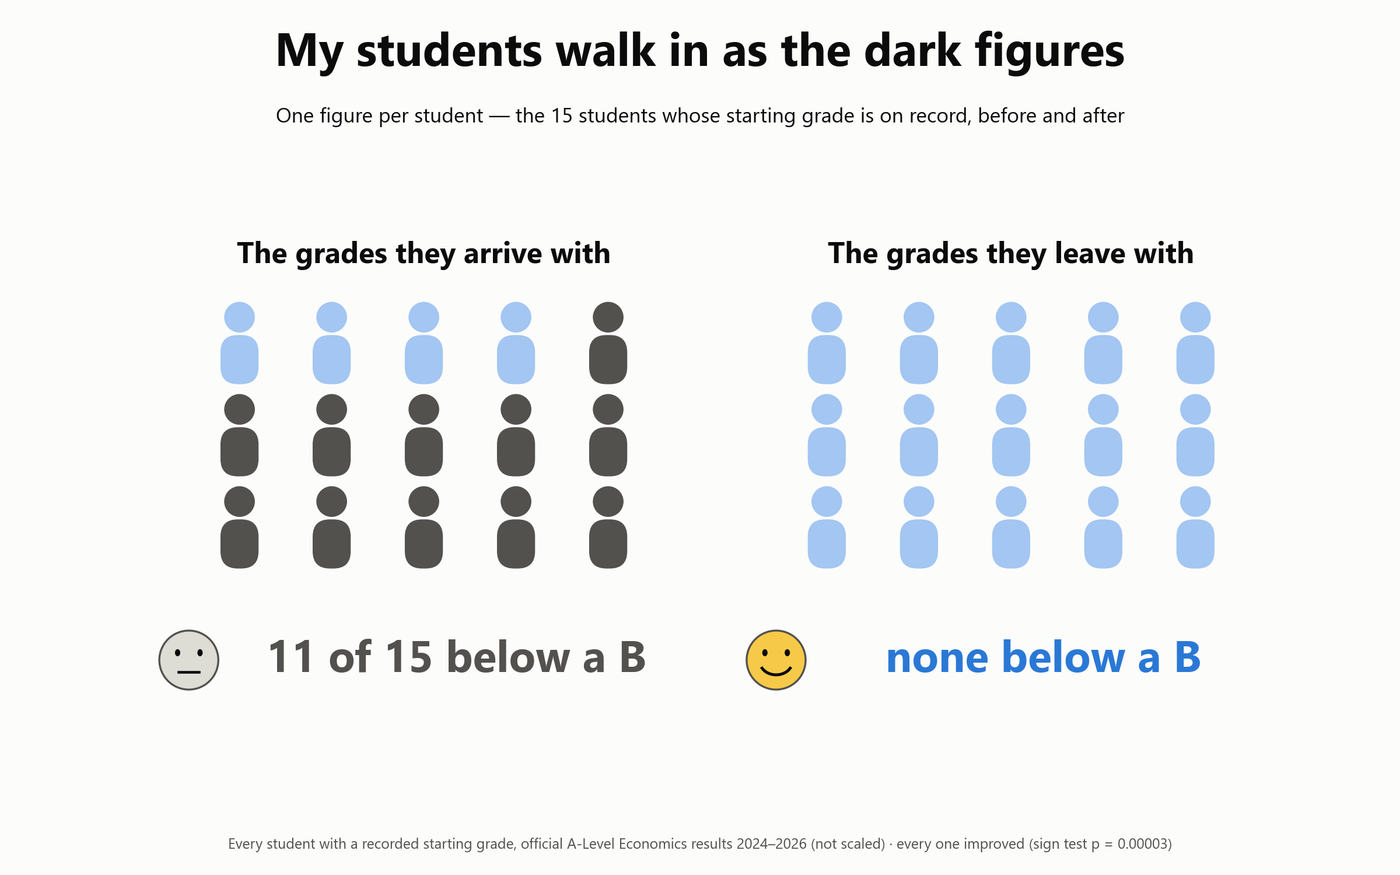
Each of these lines represents a massive improvement in one of my students’ results compared to when they come to me and when they leave; the average improvement is 2 grades after tutoring compared to before. Students on average arrive in tutoring sessions with me around a C-D as you see in the graph above, but they leave with much better results. This graph shows in practice from the tutoring sessions with me the massive value added of tutoring. Bloom found that one-to-one tutoring delivered the famous 2 sigma effect. The idea that one-to-one tutoring delivers a two standard deviation improvement in student results; these results here show the two standard deviation improvement that was captured in Bloom’s research showing the benefits of tutoring. The key aspect of how to get results like this is that the sessions have to be focused on what delivers the greatest value added for the student. In these sessions that delivered these results, I meticulously measured every deficiency in student knowledge, exam technique and ability to connect exam questions to the right topic; I then focused on remedying all of these deficiencies; using the framework that helped me get 3 prizes and the best mark in game theory in economics from Oxford, helped me build a method that simultaneously identifies and improves all the obstacles in the way of students achieving the A-A* results, which is how I manage to deliver results like these for clients.
What sort of results have you gotten?
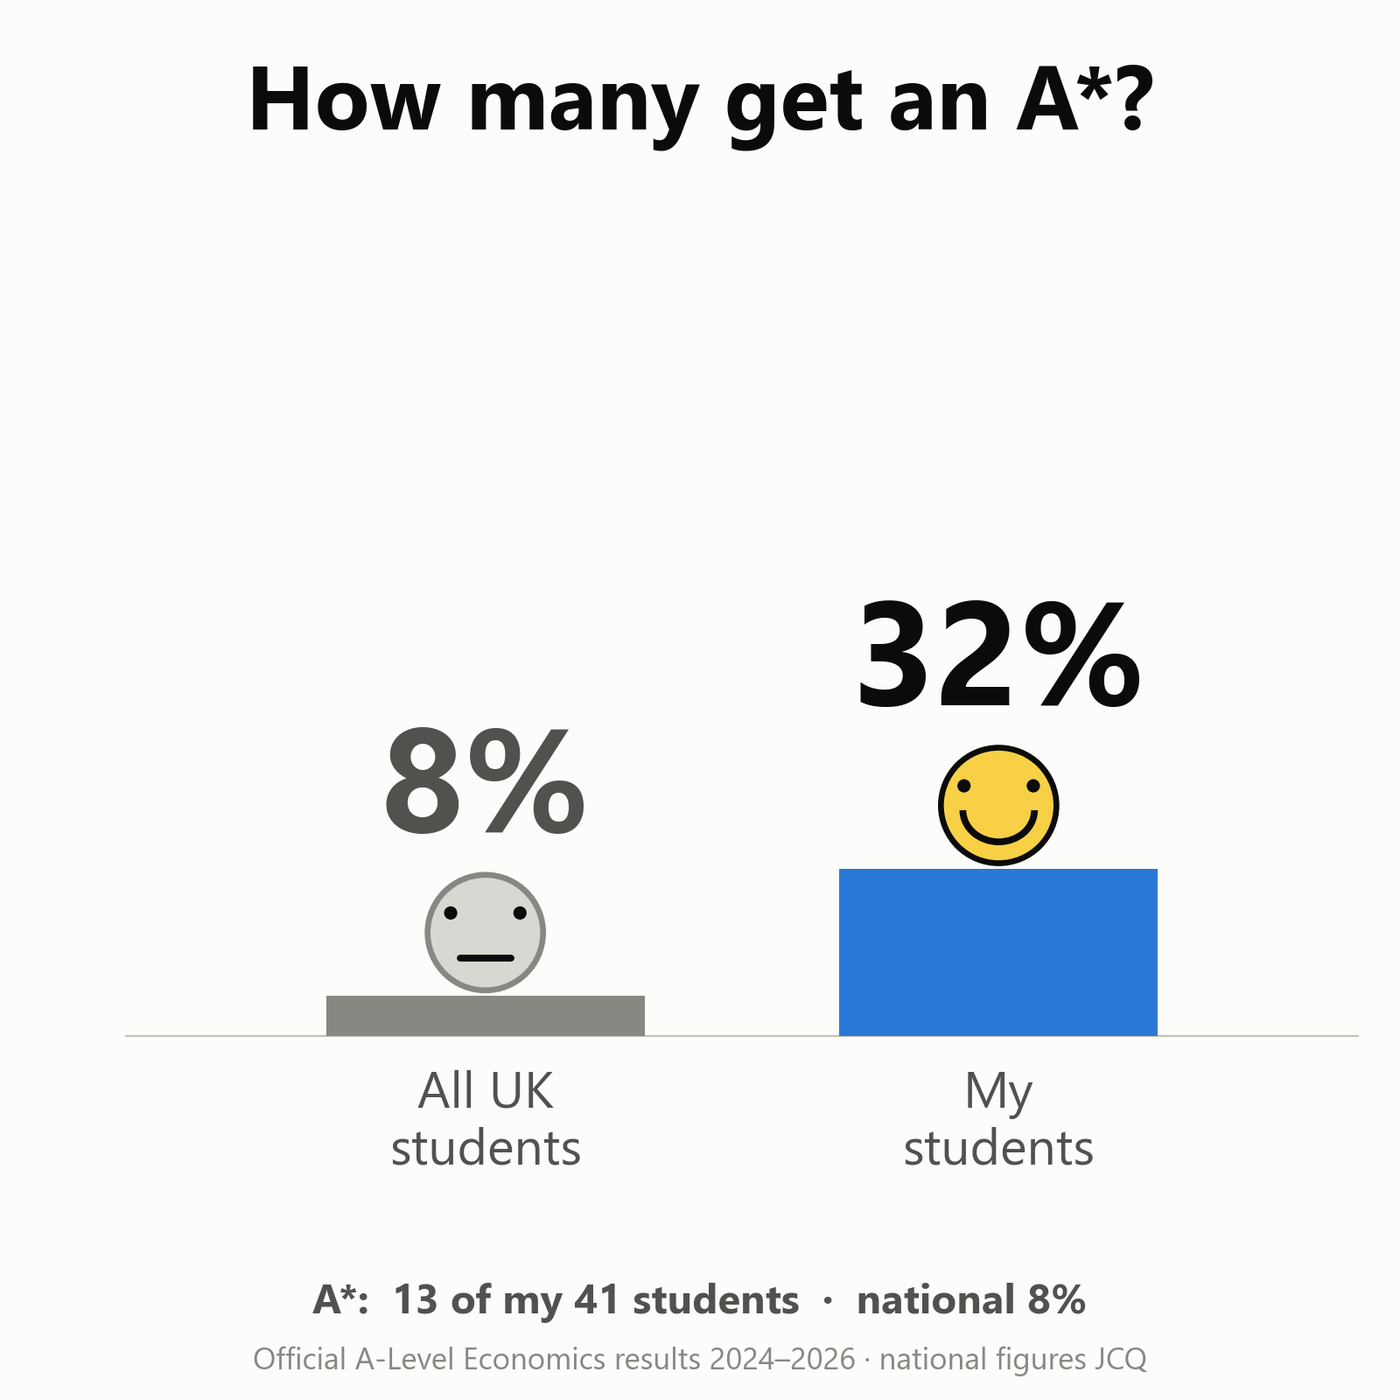
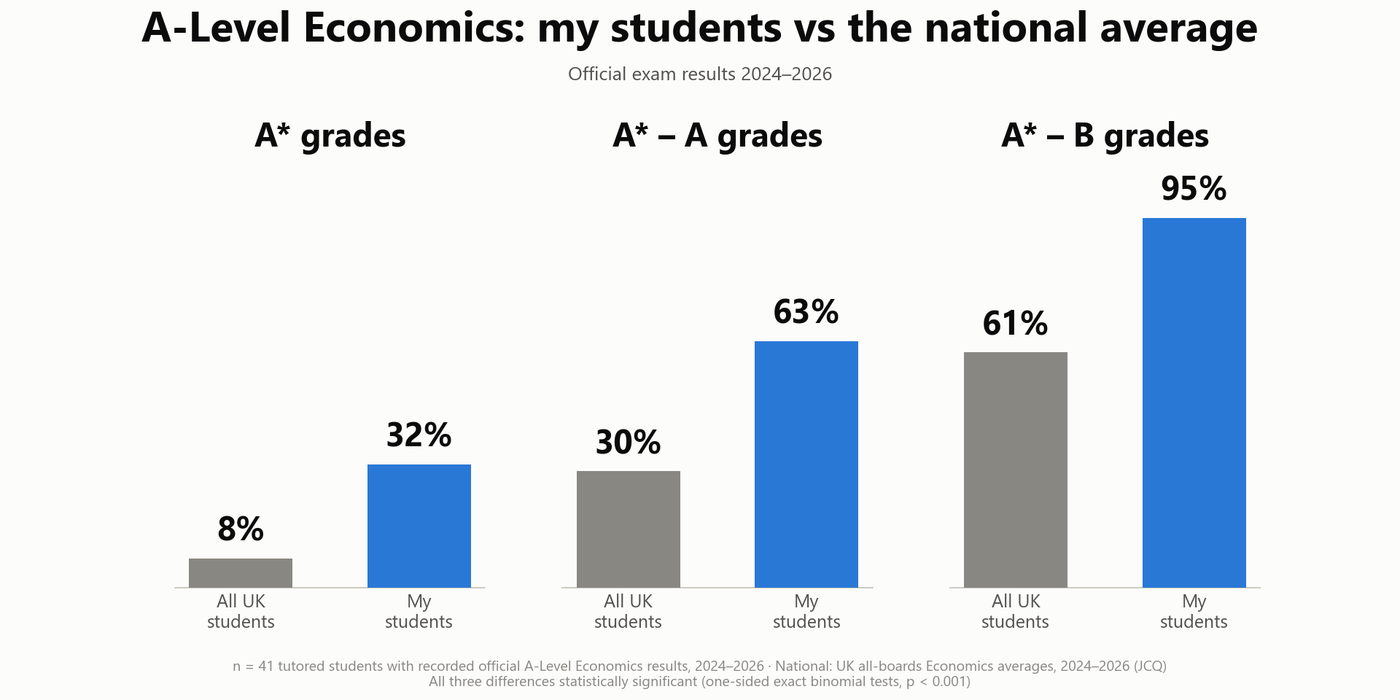
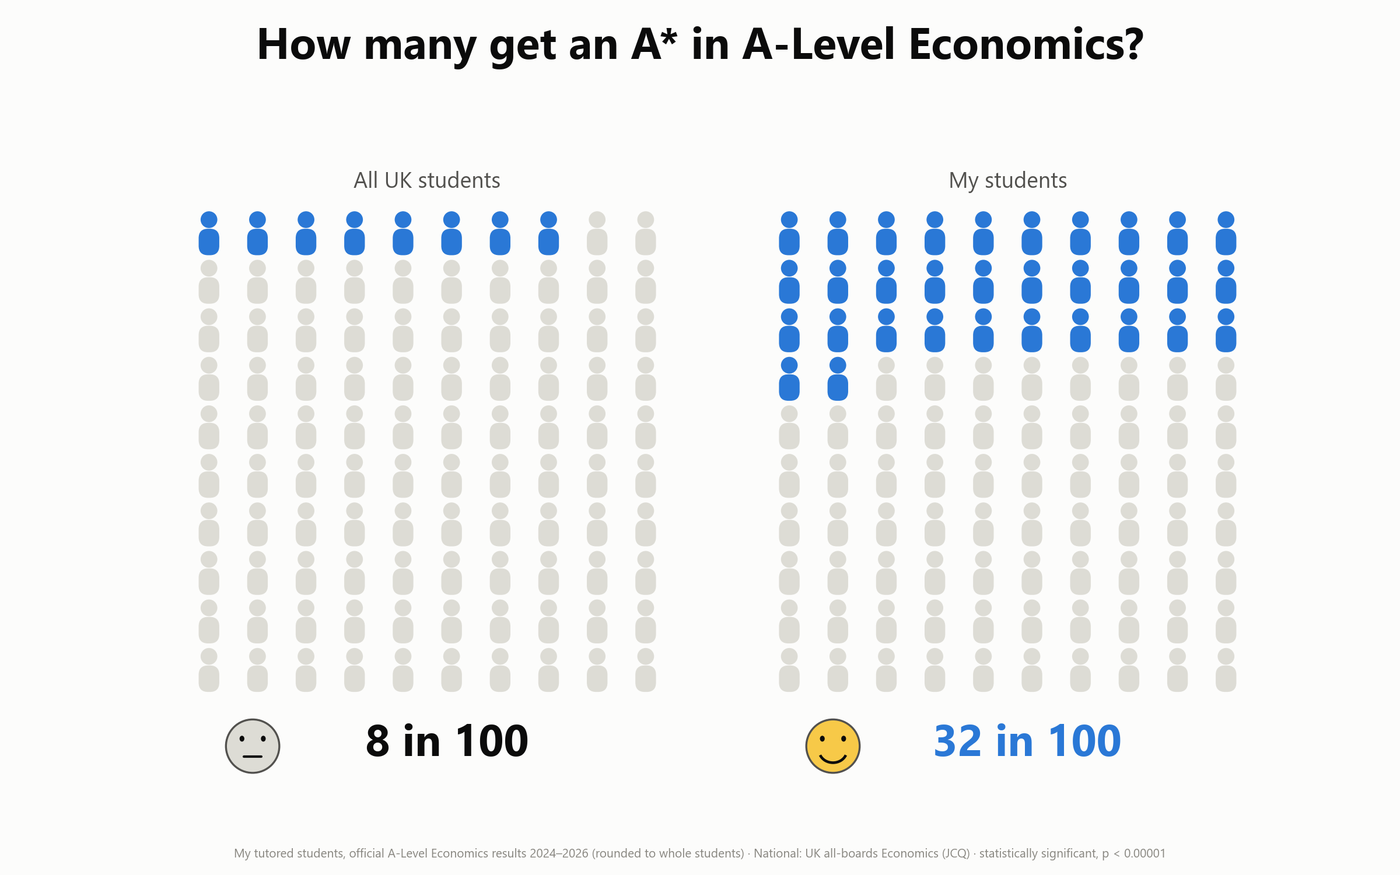
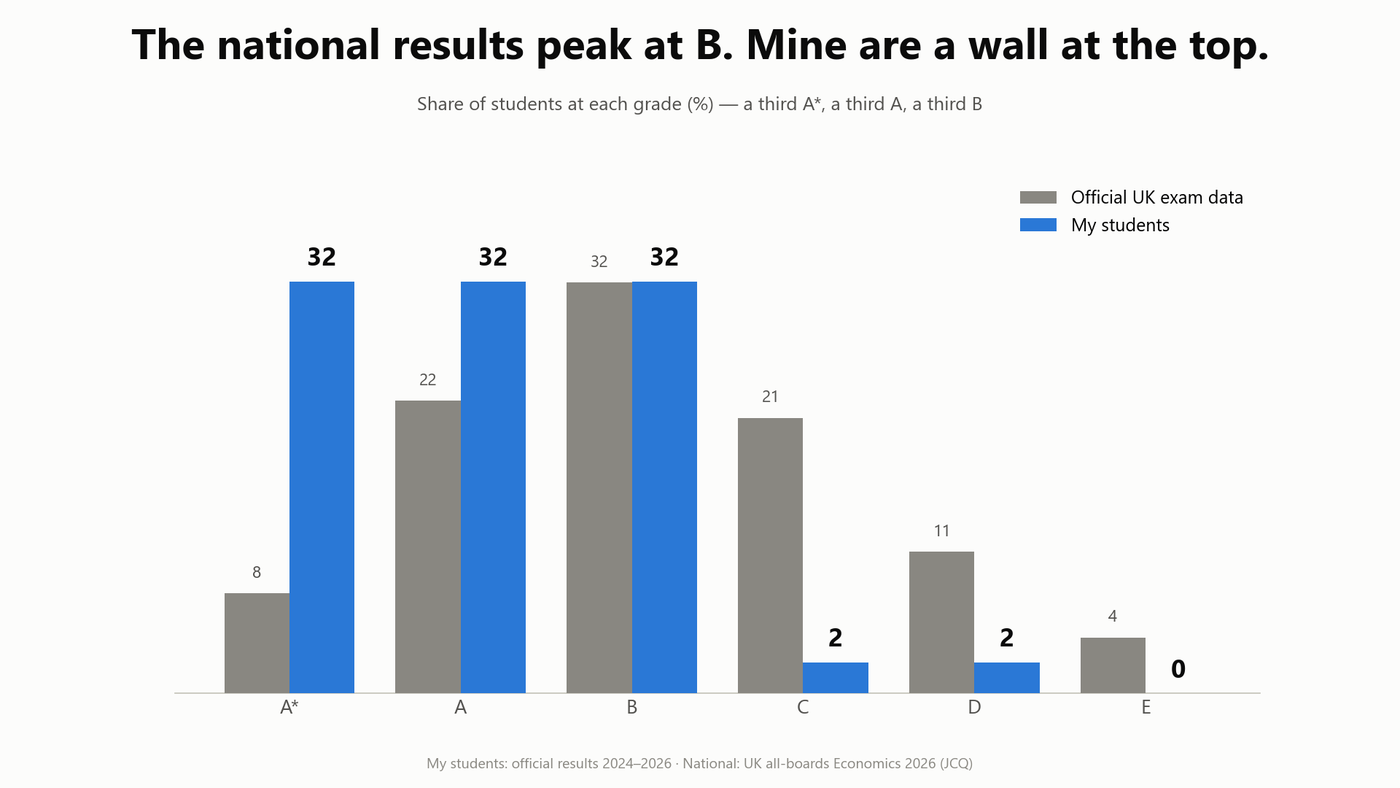
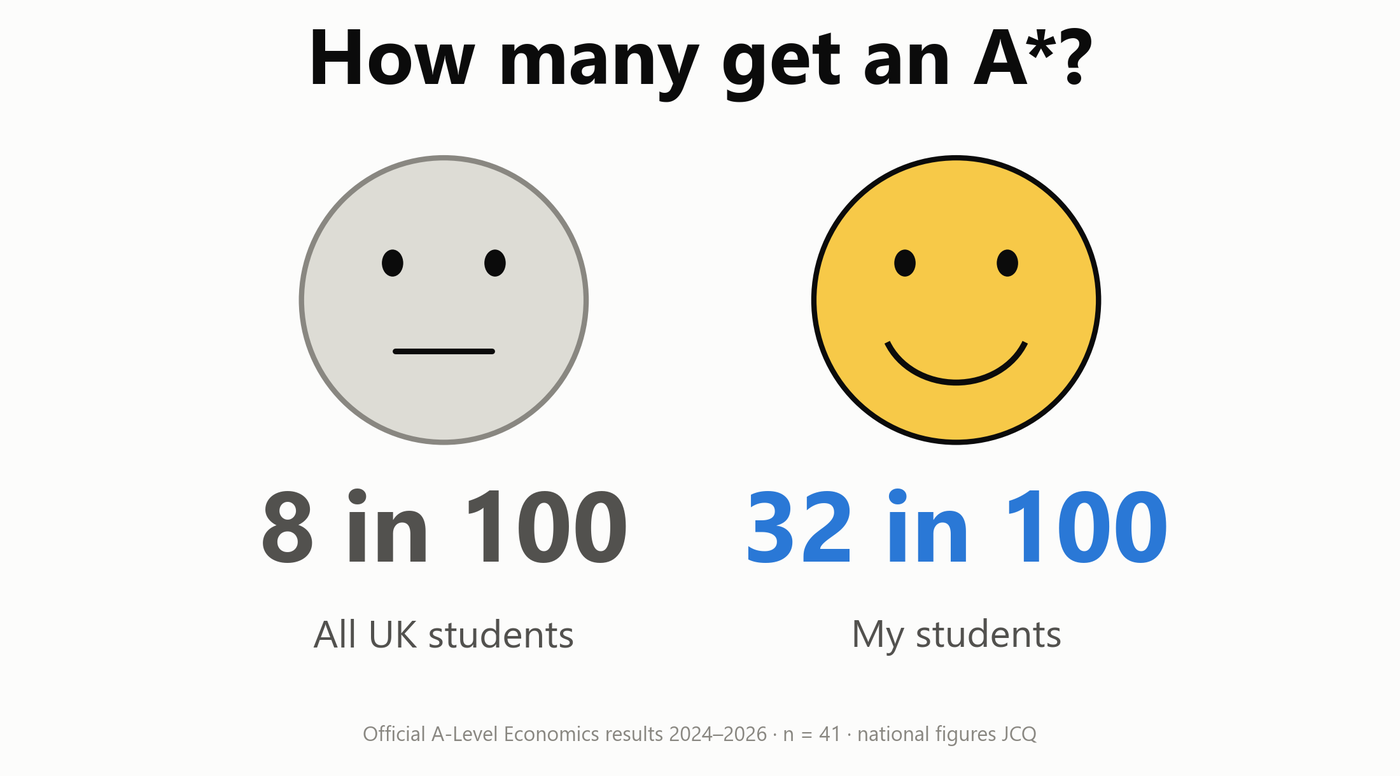
My students get fantastic results commensurate with the precise targeted maximally beneficial economics tutoring interventions I make. As we can see in the picture below, the national average A* rate is 8%, whereas the rate for my students is four times higher at 32%. There is strong statistically significant evidence that my lessons improve the A* rate for my students in a large dataset (with 41 confirmed student final exam results in the last 3 years), especially considering on average students arrive for lessons with me with starting grades around C-D due to having problems with A-Level economics, which causes parents to want to get tutoring. Therefore, the methods, diagnosis and targeted interventions I use in tutoring sessions is demonstrably improving student scores and results. Many of these top students go on to win places at Oxford, LSE, Bocconi, UCL, UCLA, Middlebury, Notre Dame and other top institutions.
FIGURES — my students against the official UK exam data. n = 41, official results 2024-2026.
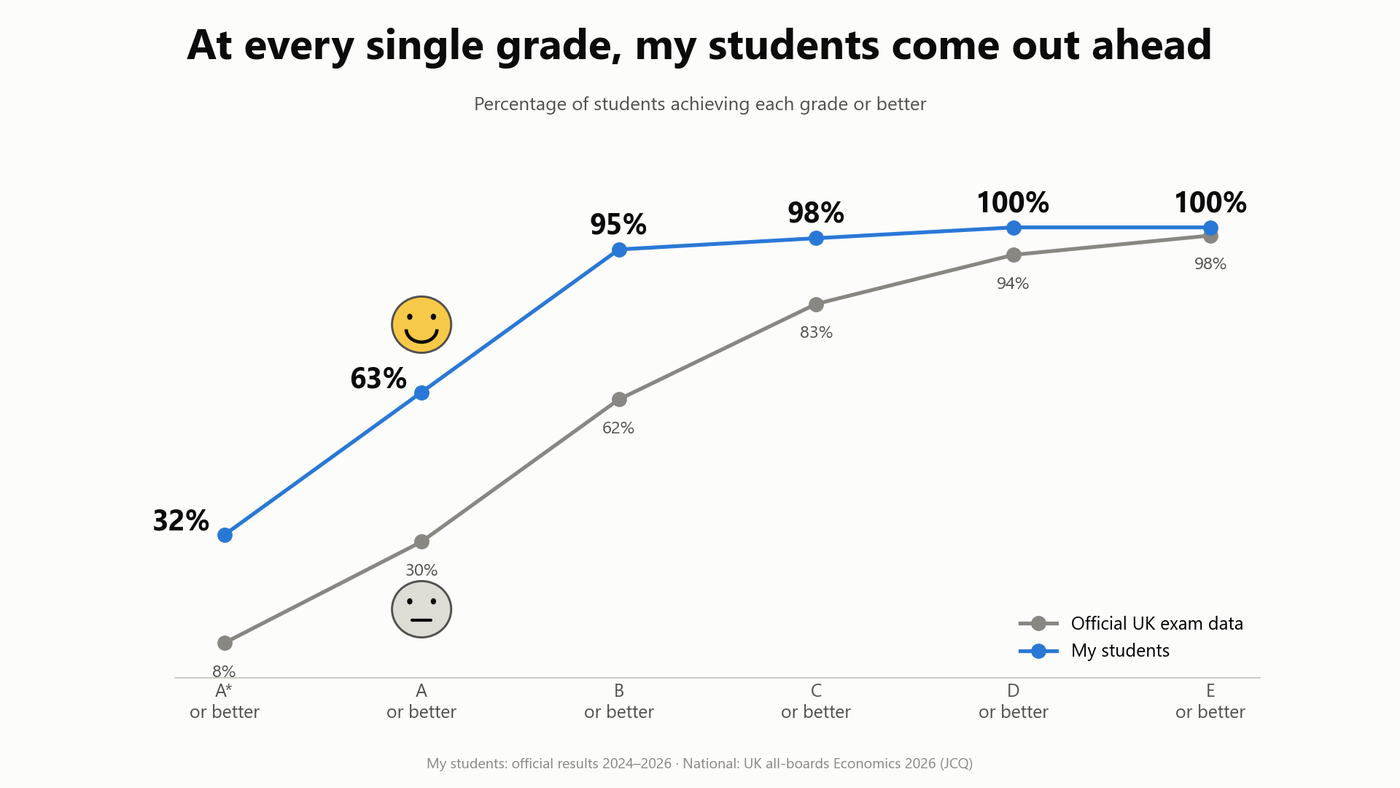
How many get an A*? 8% national, 32% mine
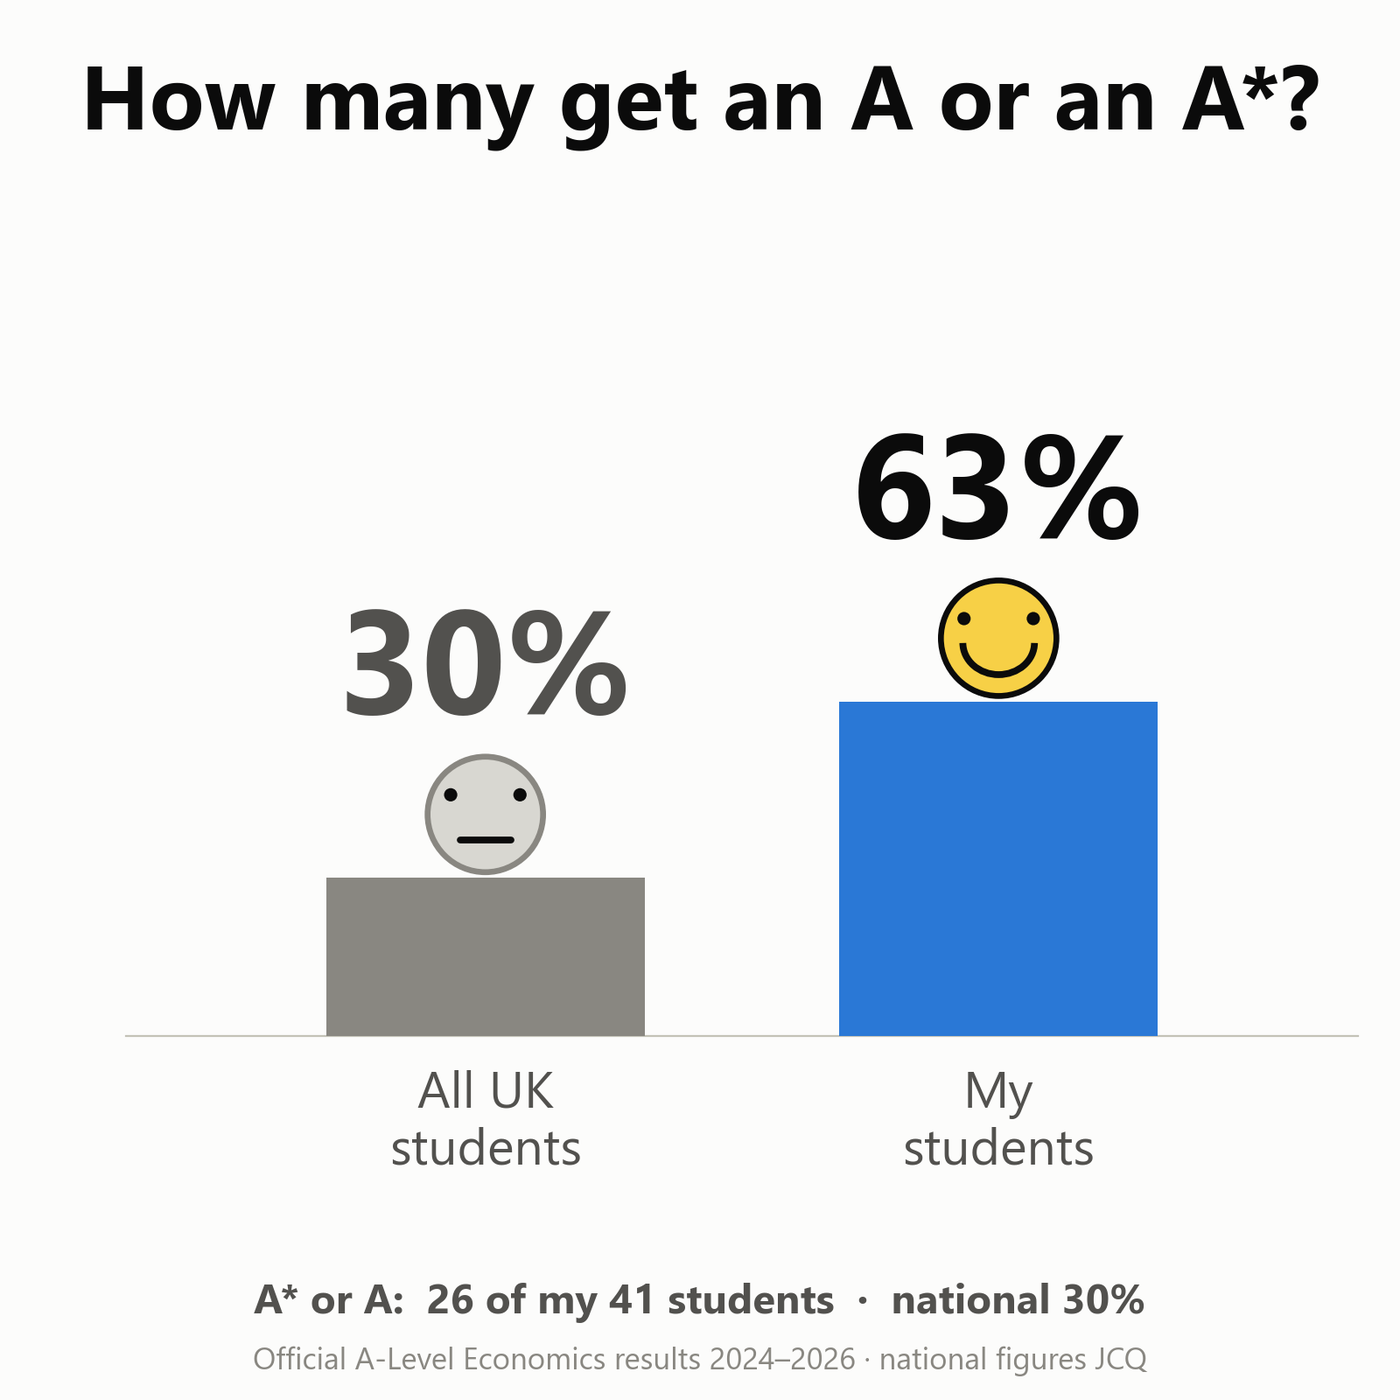
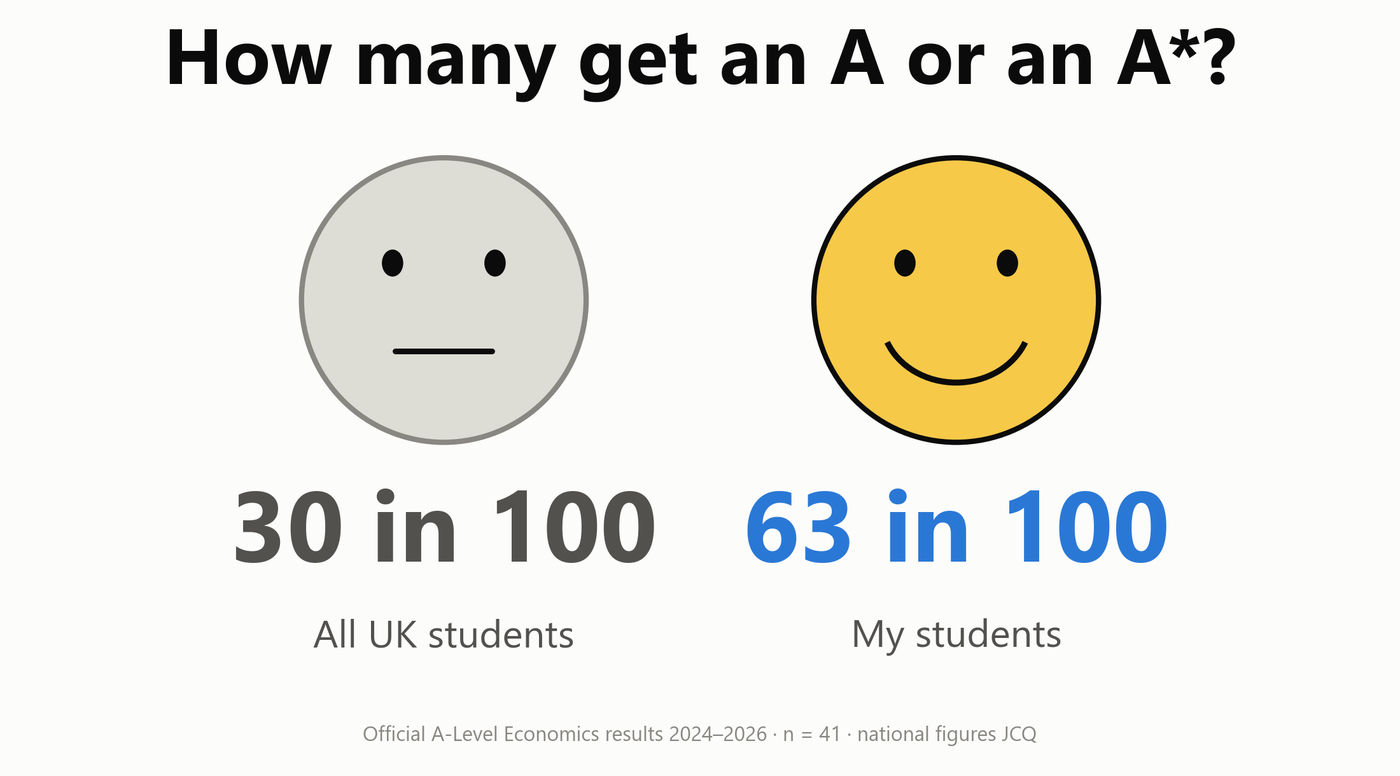
How many get an A or an A*? 30% national, 63% mine
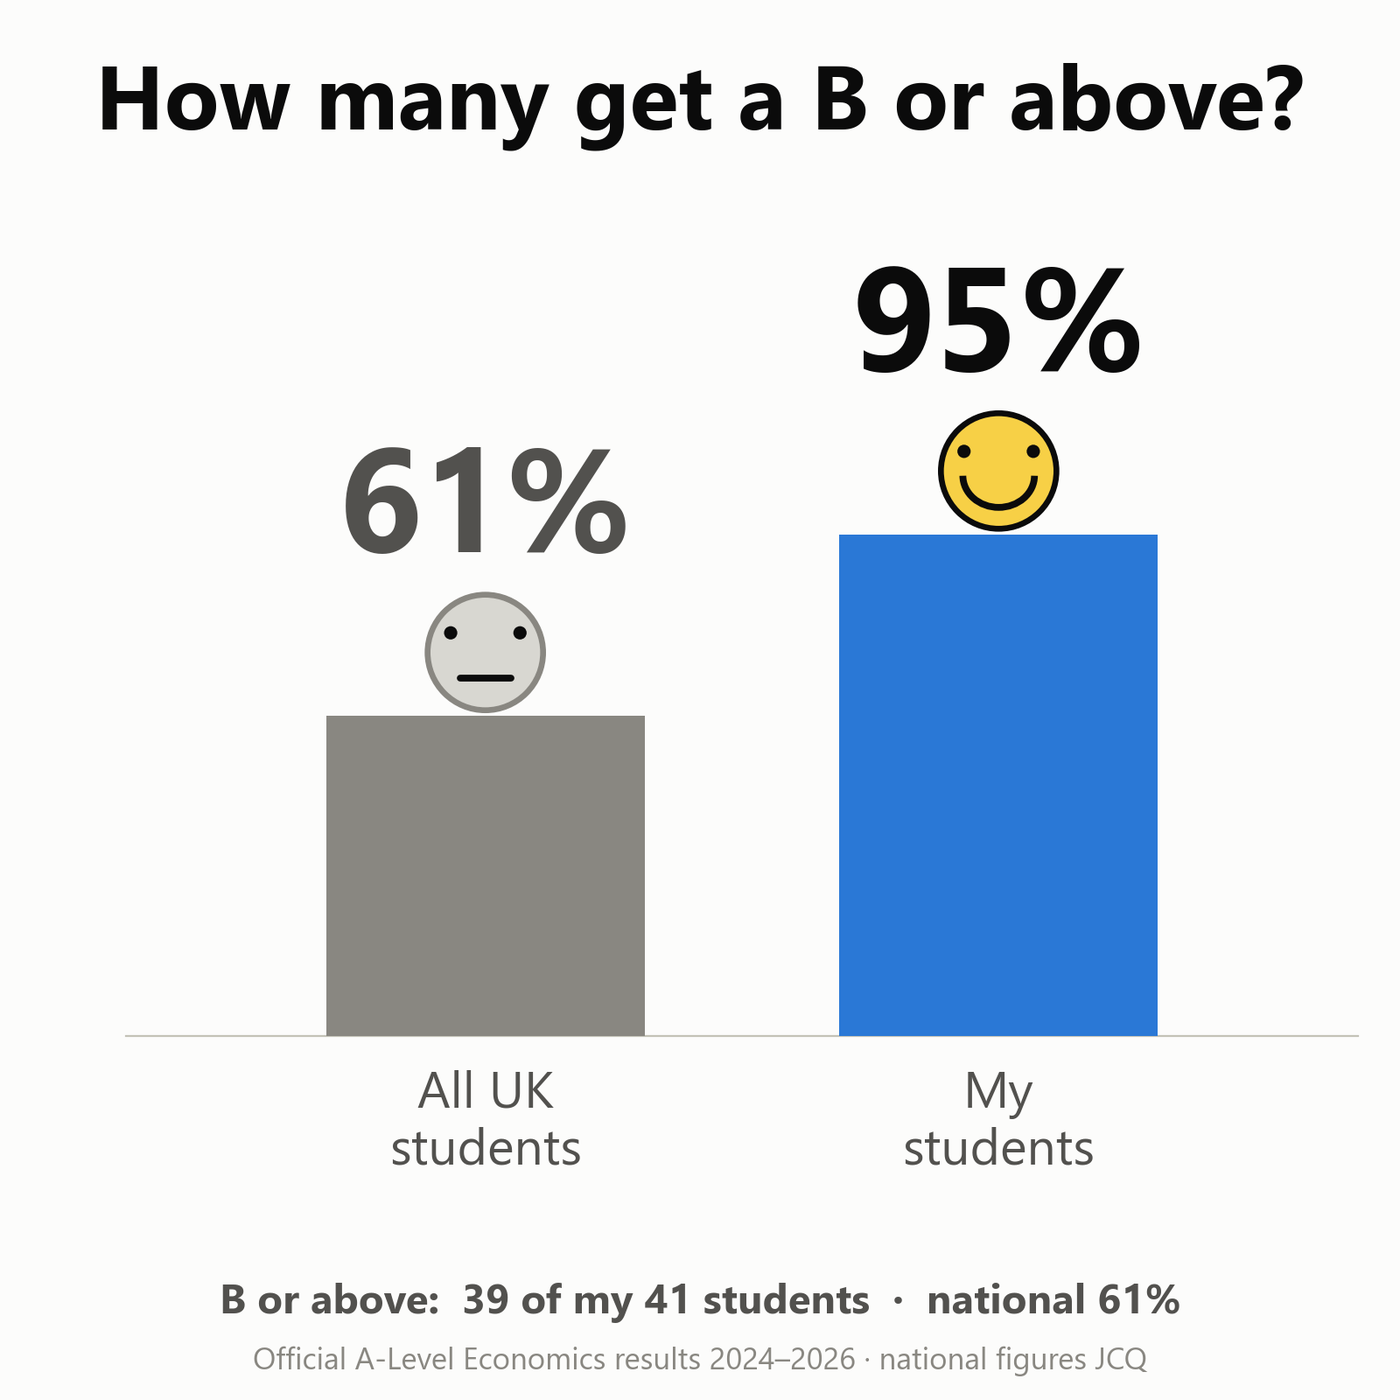
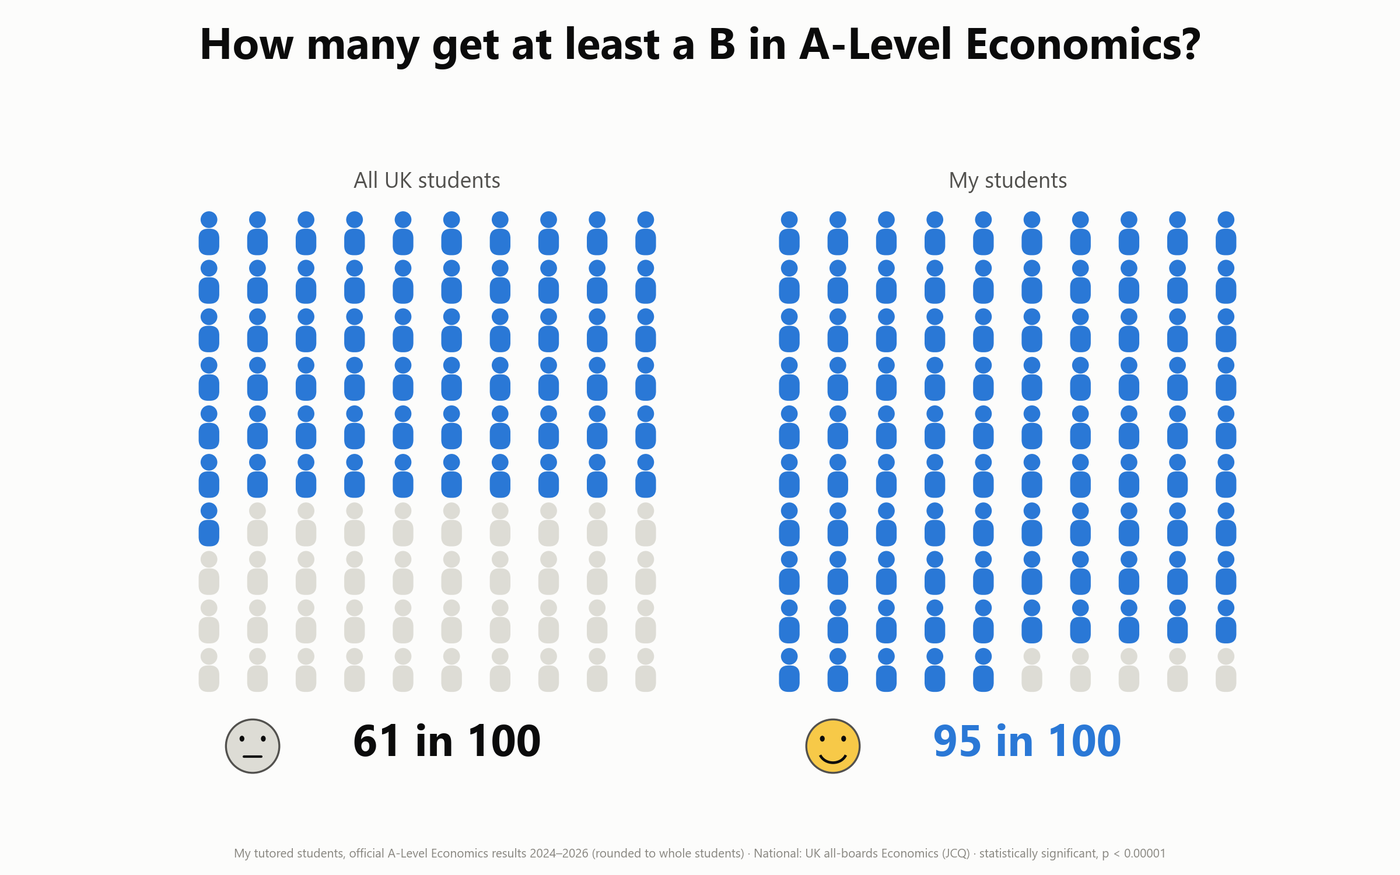
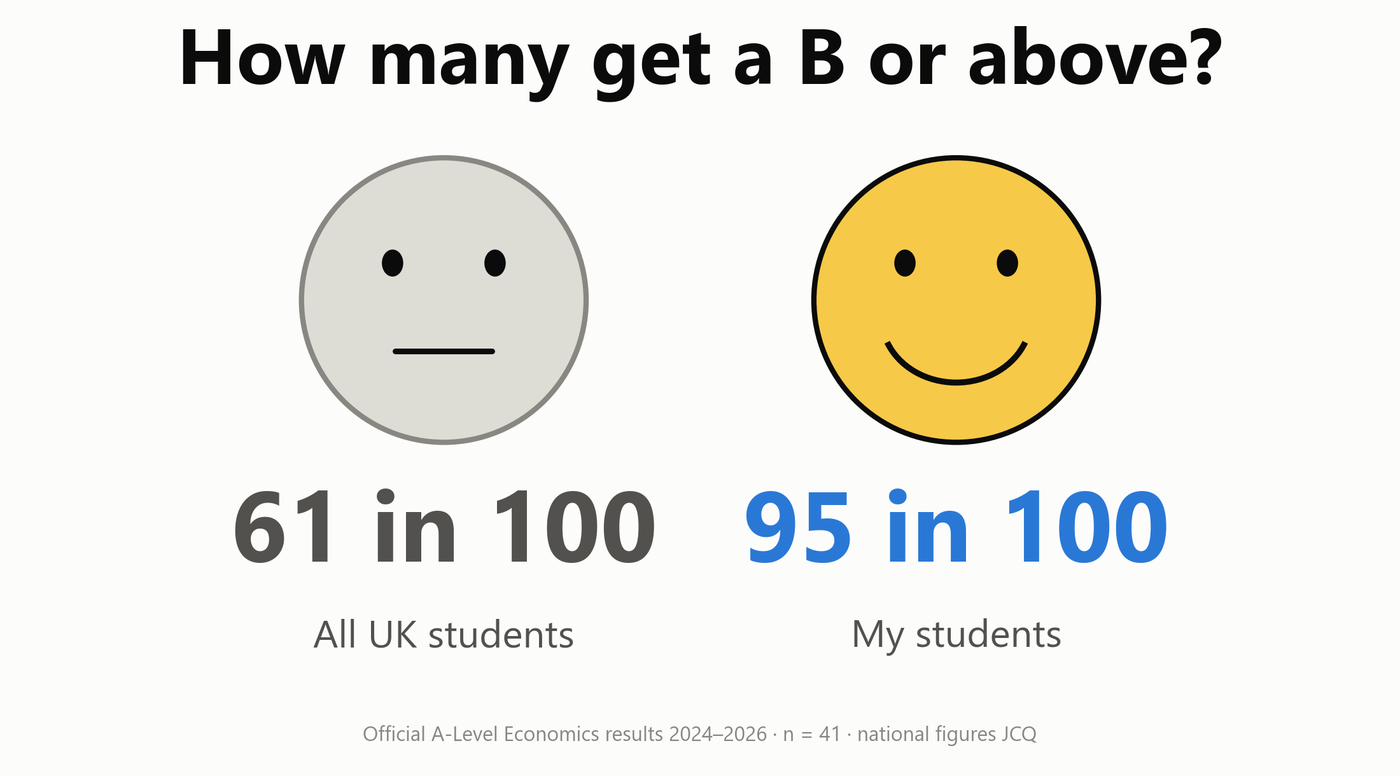
How many get a B or above? 61% national, 95% mine
My students against the national average: A*, A*-A and A*-B, 2024-2026
These exceptional results for my students are particularly strong for Edexcel.
The exam hall — Edexcel only, 2025, A or A*
7 of my 9 Edexcel students, against a national 30 in 100.
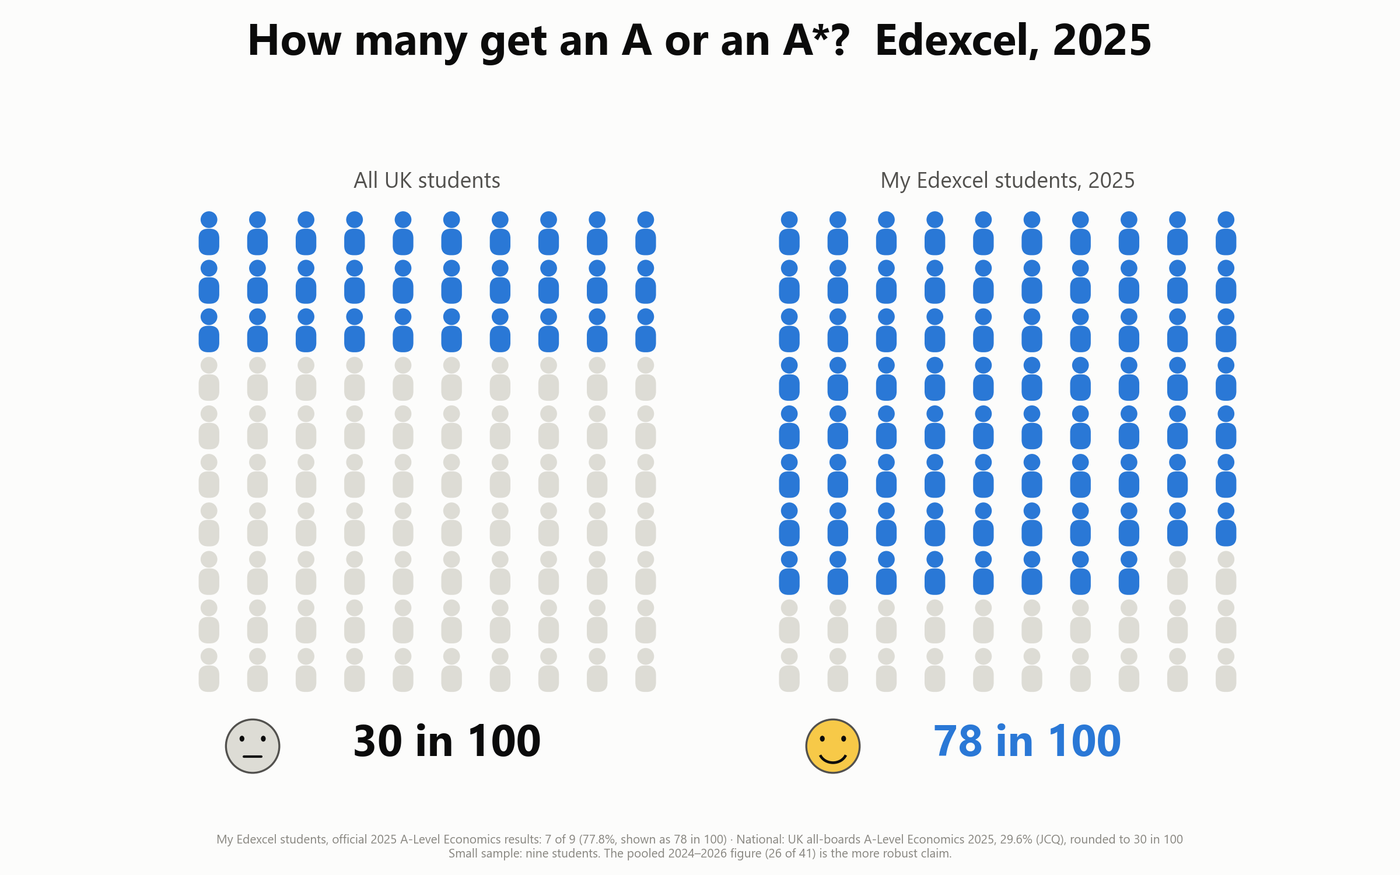
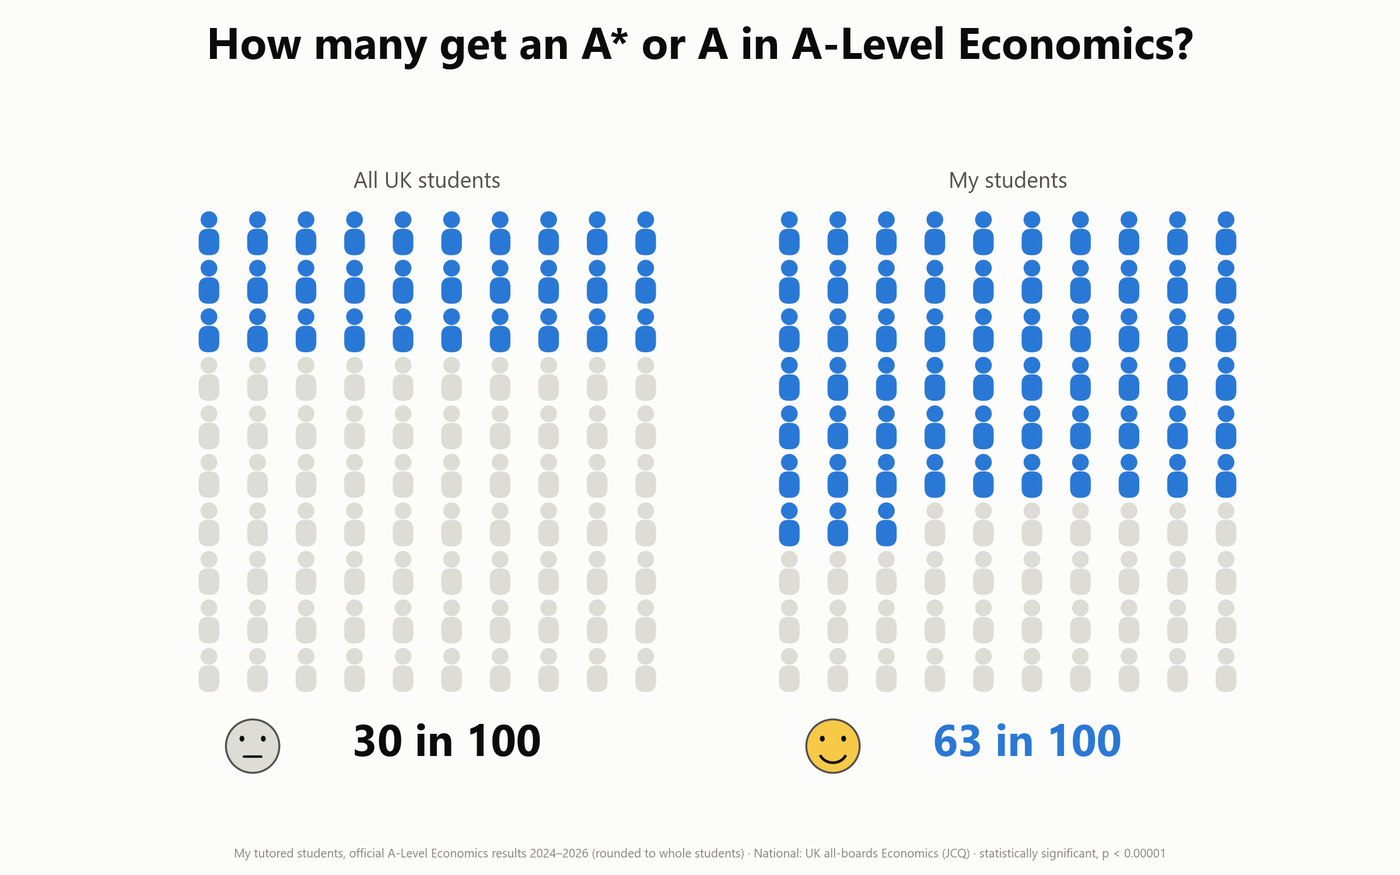
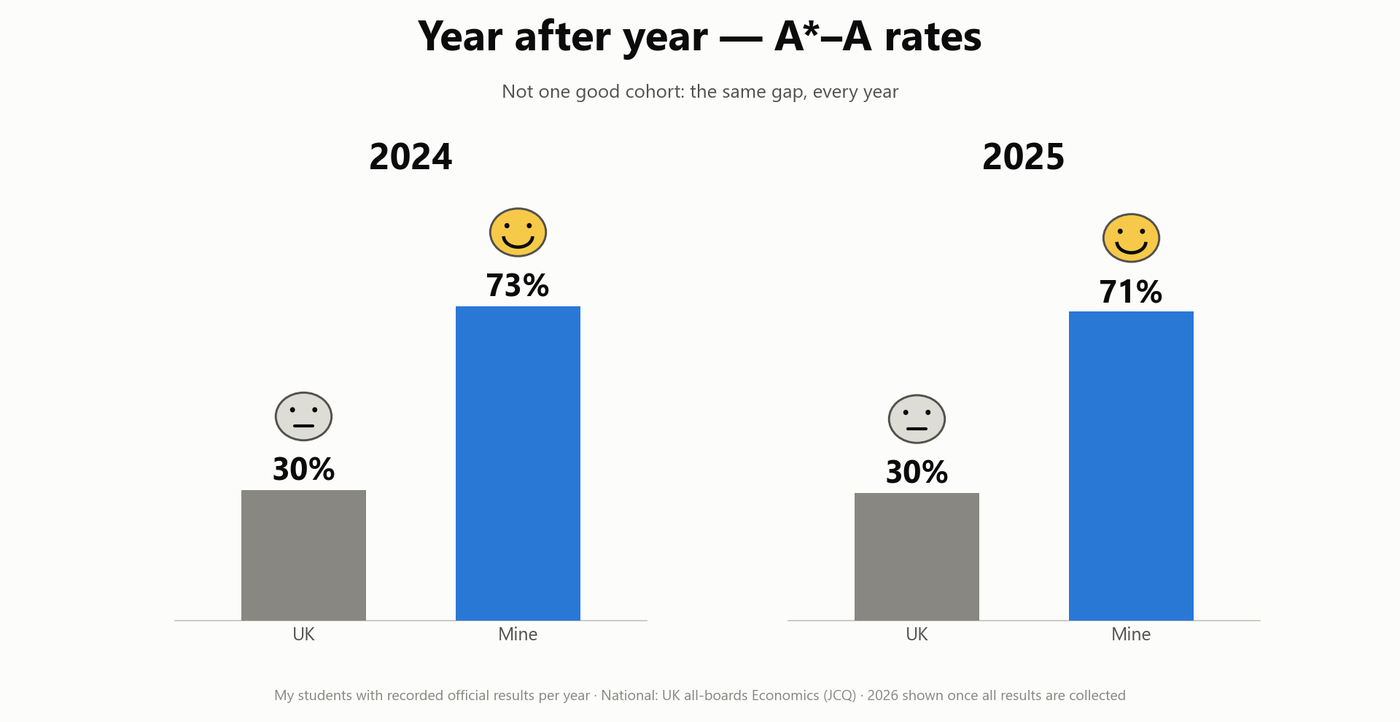
Similarly, my students are getting very strong A-A* rates, especially compared to the national average, scoring more than twice as many A-A*s as the national average; these results are comparable with scores from the best non-selective private schools, despite the fact that my students arrive with scores substantially below the national average; moreover, these exceptional results are achieved at a fraction of the cost of very expensive private schools in the UK; my students results here are nothing to do with prior selection, in that unlike top private schools (Westminster, Eton, Harrow etc. where many of my students have gone to), I have no selective admissions test to pre-select top performing students; I turn students with poorer results (C-D) into students with exceptional results (A-A*); in fact I have many documented cases of students grades improving dramatically with targeted interventions. As we can see in the data across the 41 official exam results for my students from 2024-2026, my students are scoring the A-A* at more than double the national average. Moreover, the results for my Edexcel students (where I have especially extensive experience, although having taught 160 one-to-one students I have seen helped students from all exam boards) are especially impressive, with an A-A* rate that is more than 2.5 times the national average in 2025. The probability of observing results like these by chance with no prior selection in student’s ability (if anything the reverse where my students come to be due to experiencing significant problems in economics) is a testament to the profound dramatic change I make in student performance in A-level economics.
The exam hall — A*
8 in 100 nationally. 32 in 100 of mine.
The exam hall — A or A*
30 in 100 nationally. 63 in 100 of mine.
The exam hall — B or above
61 in 100 nationally. 95 in 100 of mine.
Value added
The journey my students make
At every single grade, my students come out ahead
Year after year — A*-A rates
How the grades are distributed across the cohort
The transformation: the grades my students arrive with, and the grades they leave with — the 15 students whose starting grade is on record
Just the faces
How many get an A*?
How many get an A or an A*?
How many get a B or above?
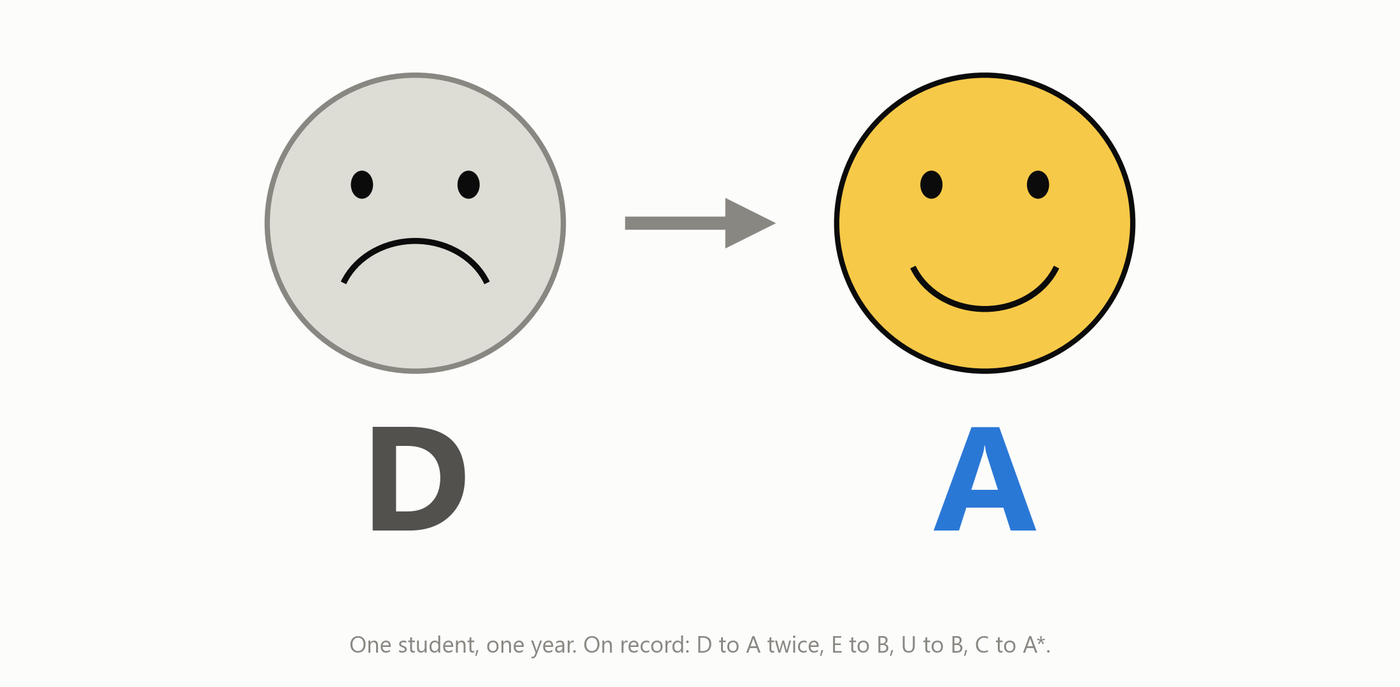
Before and after — one child, not a population
Includes every student who told me their final official A-Level Economics grade, 2024–2026 (41 students). In 2026 I messaged all 22 of my students who sat the exam that year, and 16 replied confirming their grade.