TAP A DIAGRAM TO PLAY THE ECONOMICS A-LEVEL DIAGRAM GAME

George Chantry, professional A-Level Economics tutor
George Chantry

Detailed knowledge of the diagrams separates A* students from the rest — the diagram is the model, the 20% of knowledge that delivers 80% of the return. It’s fast and fun to learn with the diagram game.

START — PICK YOUR TOPICS →
Three taps and you are playing questions at your level.
YEAR 12 · MICROECONOMICS
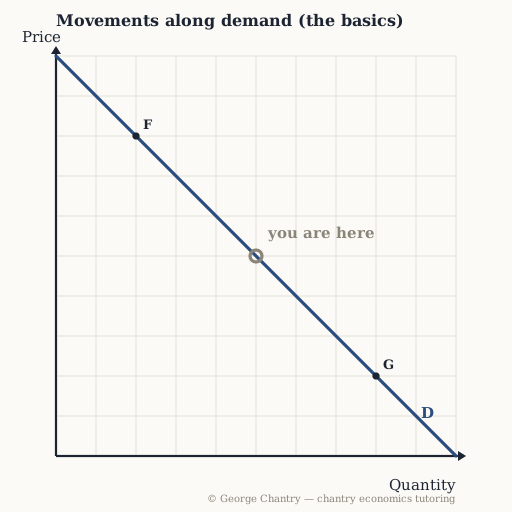
Movements along demand (the basics)
Movements along demand (the basics) diagram
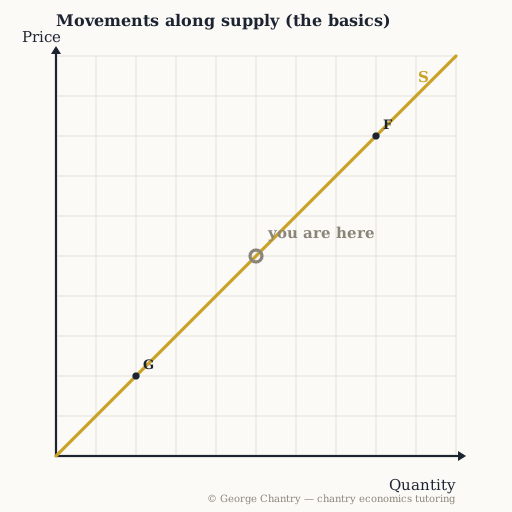
Movements along supply (the basics)
Movements along supply (the basics) diagram
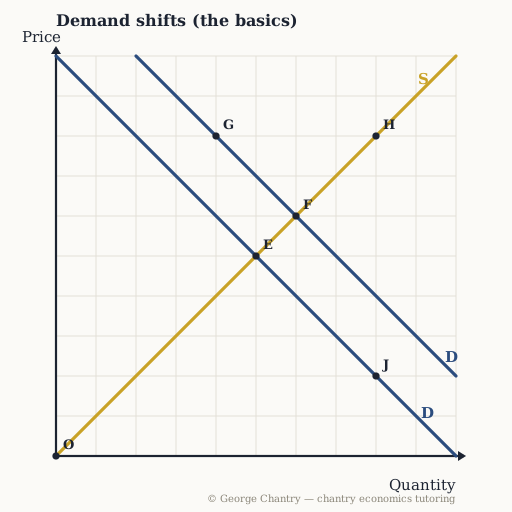
Demand shifts (the basics)
Demand shifts (the basics) diagram
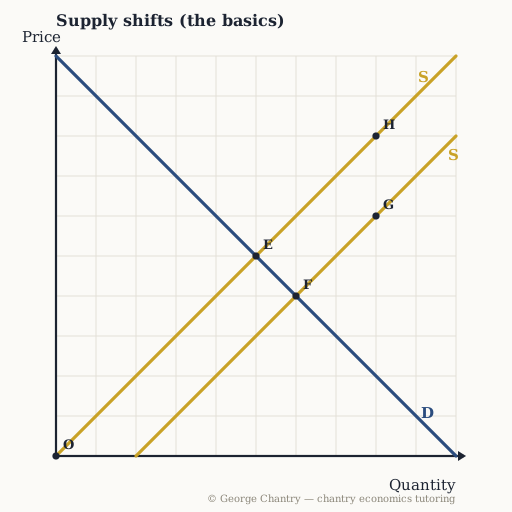
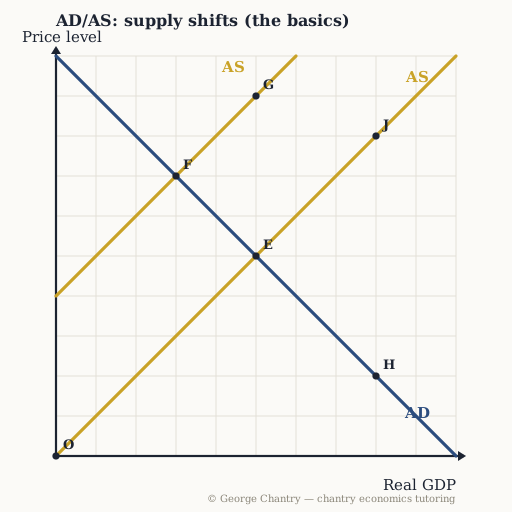
Supply shifts (the basics)
Supply shifts (the basics) diagram
Consumer & producer surplus
Consumer & producer surplus diagram
Production possibility frontier
Production possibility frontier diagram
Indirect tax
Indirect tax diagram
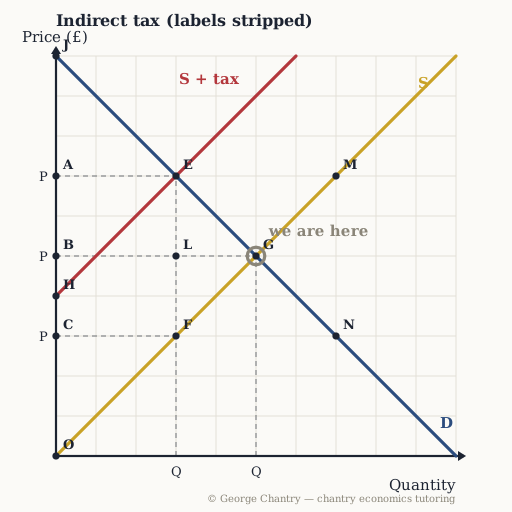
Indirect tax (labels stripped)
Indirect tax (labels stripped) diagram
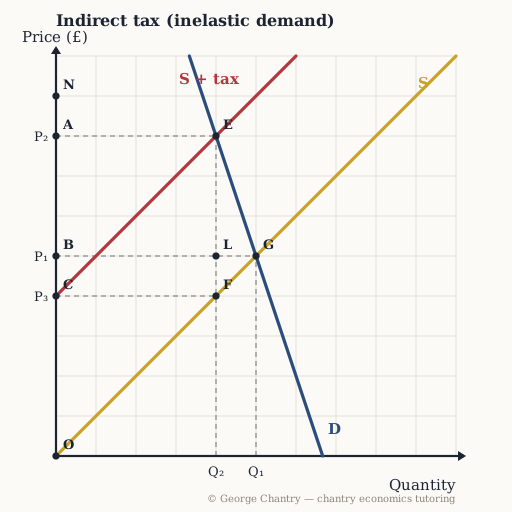
Indirect tax (inelastic demand)
Indirect tax (inelastic demand) diagram
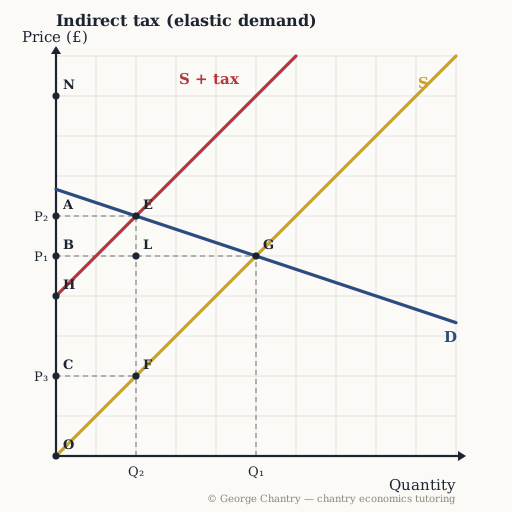
Indirect tax (elastic demand)
Indirect tax (elastic demand) diagram
Subsidy
Subsidy diagram
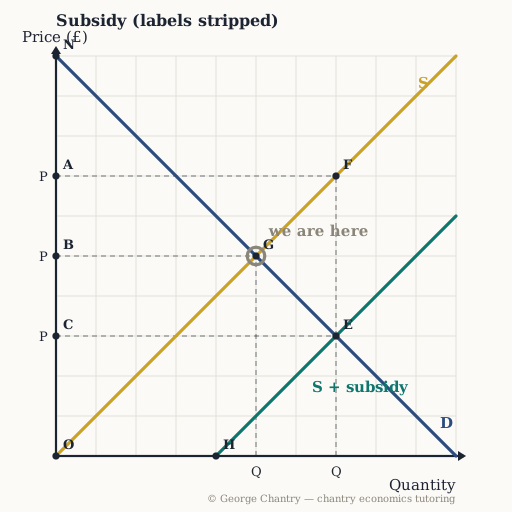
Subsidy (labels stripped)
Subsidy (labels stripped) diagram
Maximum price
Maximum price diagram
Minimum price
Minimum price diagram
Negative production externality
Negative production externality diagram
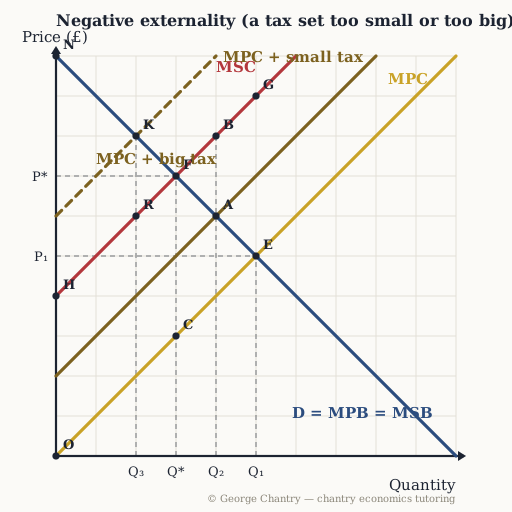
Negative externality (a tax set too small or too big)
Negative externality (a tax set too small or too big) diagram
Positive consumption externality
Positive consumption externality diagram
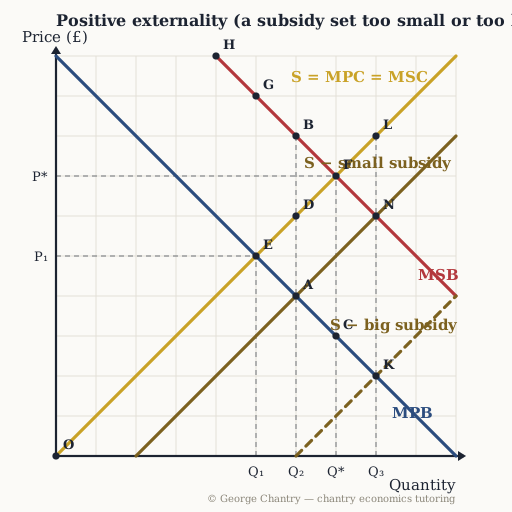
Positive externality (a subsidy set too small or too big)
Positive externality (a subsidy set too small or too big) diagram
Positive production externality
Positive production externality diagram
Negative consumption externality
Negative consumption externality diagram
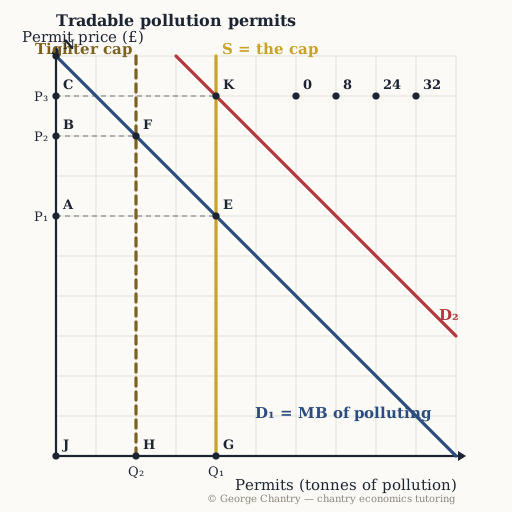
Tradable pollution permits
Tradable pollution permits diagram
YEAR 12 · MACROECONOMICS
AD/AS: supply shifts (the basics)
AD/AS: supply shifts (the basics) diagram
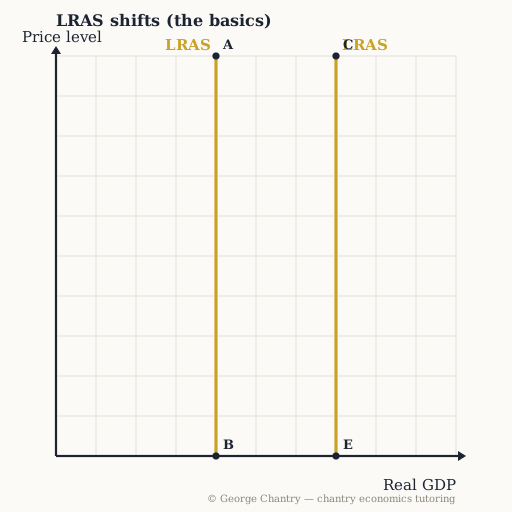
LRAS shifts (the basics)
LRAS shifts (the basics) diagram
AD/AS equilibrium
AD/AS equilibrium diagram
AD shift right (with multiplier)
AD shift right (with multiplier) diagram
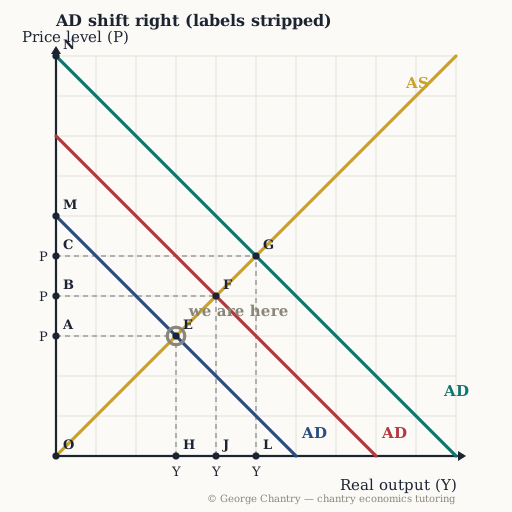
AD shift right (labels stripped)
AD shift right (labels stripped) diagram
AD shift left (recession)
AD shift left (recession) diagram
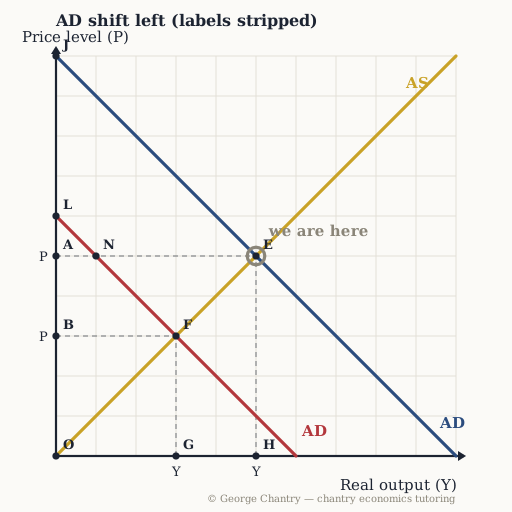
AD shift left (labels stripped)
AD shift left (labels stripped) diagram
SRAS shift left (cost-push inflation)
SRAS shift left (cost-push inflation) diagram
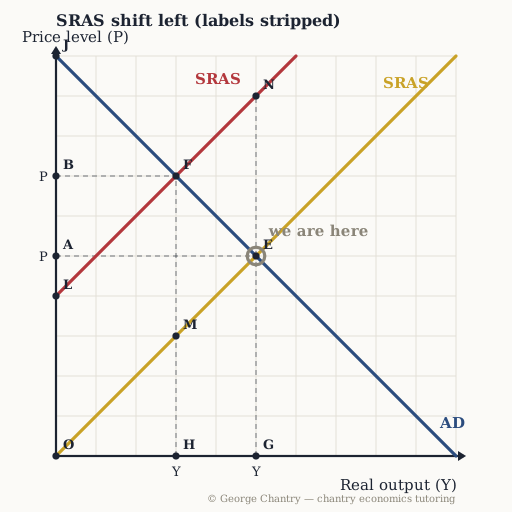
SRAS shift left (labels stripped)
SRAS shift left (labels stripped) diagram
LRAS shift right (long-run growth)
LRAS shift right (long-run growth) diagram
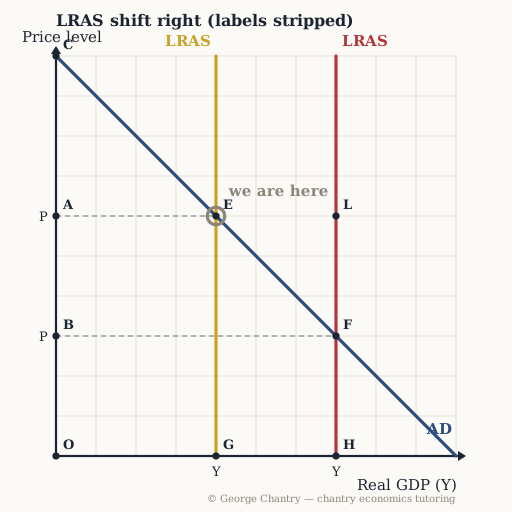
LRAS shift right (labels stripped)
LRAS shift right (labels stripped) diagram
Keynesian LRAS (spare capacity)
Keynesian LRAS (spare capacity) diagram
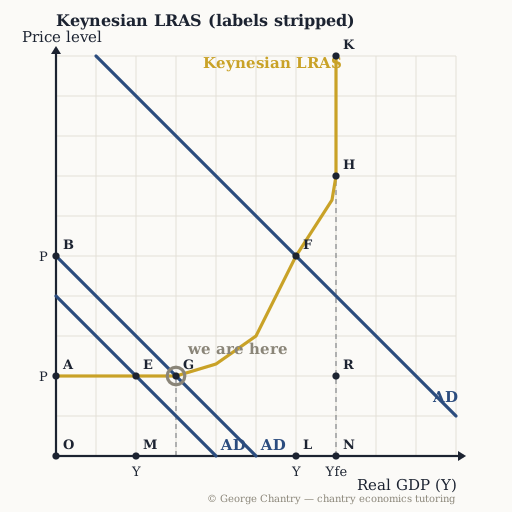
Keynesian LRAS (labels stripped)
Keynesian LRAS (labels stripped) diagram
Loanable funds (crowding out)
Loanable funds (crowding out) diagram
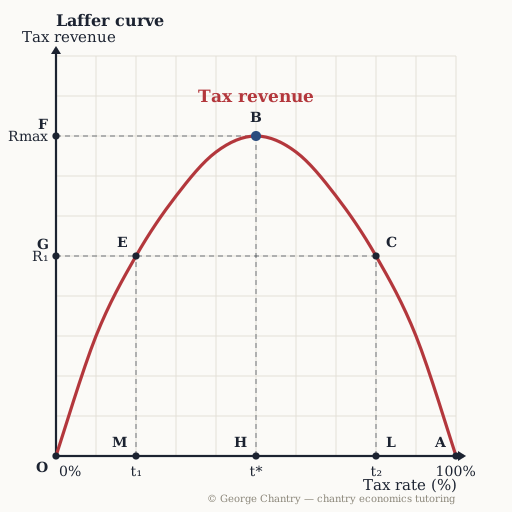
Laffer curve
Laffer curve diagram
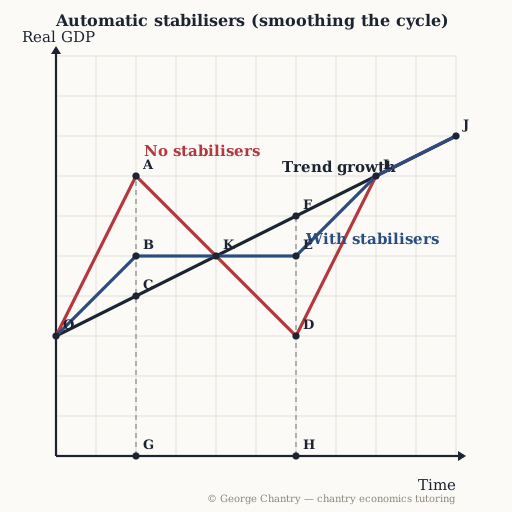
Automatic stabilisers (smoothing the cycle)
Automatic stabilisers (smoothing the cycle) diagram
Short-run Phillips curve
Short-run Phillips curve diagram
PPF outward shift (economic growth)
PPF outward shift (economic growth) diagram
YEAR 13
Monopoly (supernormal profit)
Monopoly (supernormal profit) diagram
Perfect competition (short-run profit)
Perfect competition (short-run profit) diagram
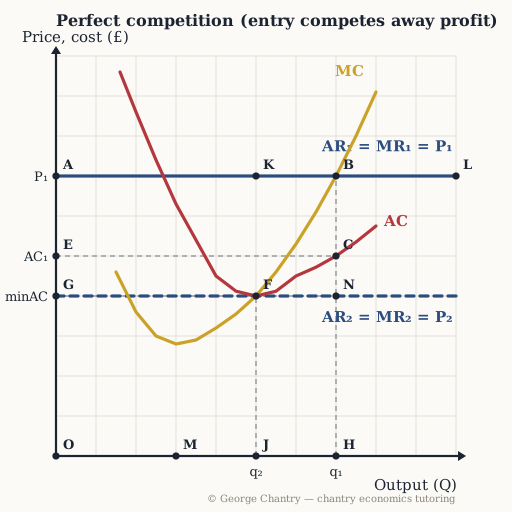
Perfect competition (entry competes away profit)
Perfect competition (entry competes away profit) diagram
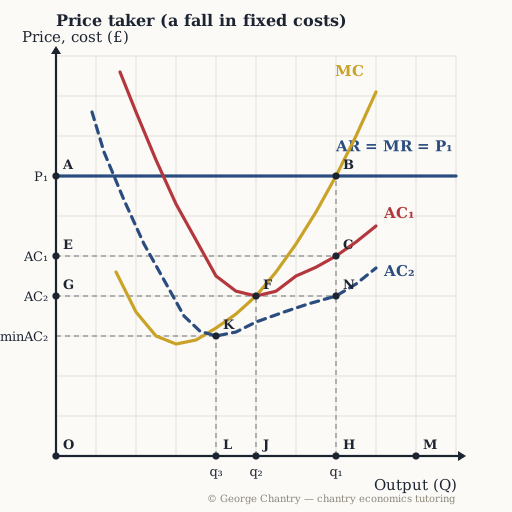
Price taker (a fall in fixed costs)
Price taker (a fall in fixed costs) diagram
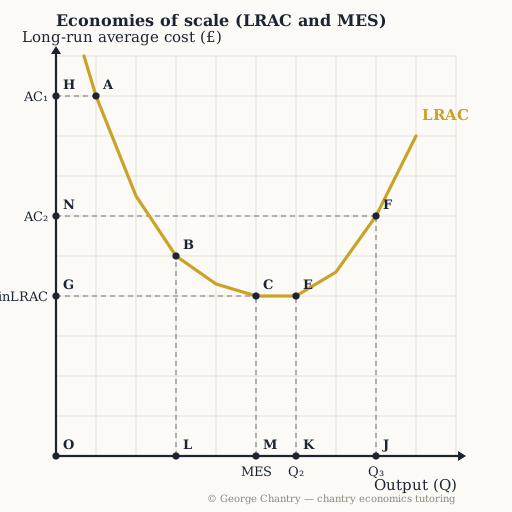
Economies of scale (LRAC and MES)
Economies of scale (LRAC and MES) diagram
Monopsony labour market
Monopsony labour market diagram
Tariff
Tariff diagram
Currency depreciation
Currency depreciation diagram
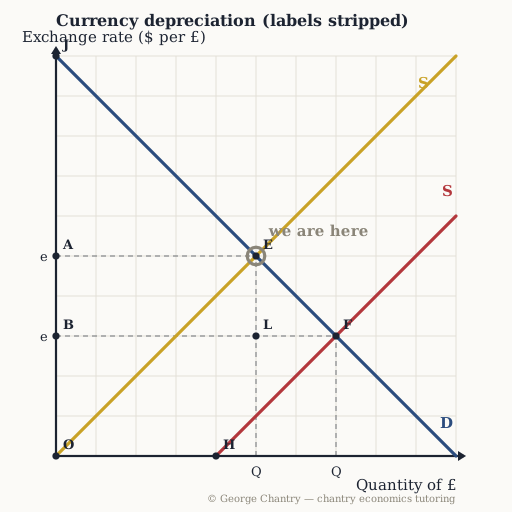
Currency depreciation (labels stripped)
Currency depreciation (labels stripped) diagram
Currency appreciation (hot money)
Currency appreciation (hot money) diagram
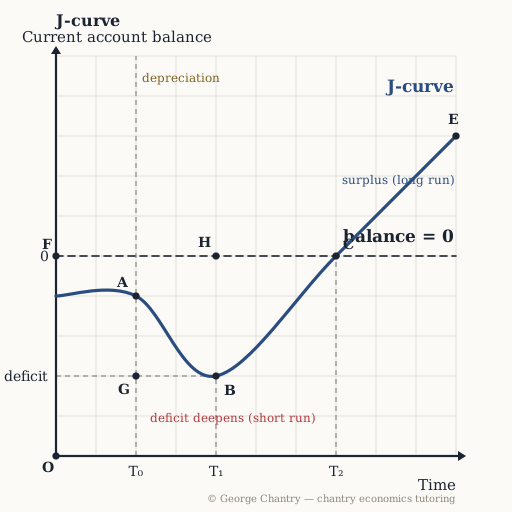
J-curve
J-curve diagram
Lorenz curve
Lorenz curve diagram
© George Chantry. Built from my own teaching materials. All rights reserved.